Wednesday, 14 February 2018

WoodenBooks


The “Wooden Books” is a series of beautifully illustrated books addressing various fields within art, mathematics, and science. I have an interest in Classical Education and first read “Quadrivium” from this series. It gave me historical and artistic information on mathematics and geometry that I made use of on my placement to enormous success in the Grade 9 geometry unit. I have also used them as supplementary material in my tutoring, again always to very positive response. Once student immediately went out and bought a set of them for herself. The information contained in these books gives not so much the utilitarian information that the curriculum is based on, but the historical-aesthetic context of the subject matter. Additionally, it generally draws upon a range of Middle Eastern and Asian sources besides those of the Middle Ages and Ancient World. The artistic material is particularly good for making geometry activities. For example, I used the chapter on tiling to easily make the following patterns on my computer from scratch. Each tile is actually made of four copies of a smaller tile, which have been rotated 0, 90, 180, or 270 degrees respectively in order to made a more complicated pattern. Of course, much more complicated patterns can be easily made from a single image with a little more planning.


Analogies for Negative Numbers

I had students (plural mind you) on my last placement that had failed grade 10 math twice and were taking it for the third time. These students were also likely to fail again. As expected, the big issue was their poor arithmetic and number sense. One student told me that 1 + 0.25 = 0.7. Another had no idea how to do addition and subtraction when negative numbers were involved, and generally wouldn’t bother to include negatives. For this post, I decided to do some reading on how other people explain negative numbers and do a little review of the ones that stuck out.

Start – Direction – Distance


This approach uses a vertical number line. They start with addition and subtraction of positive numbers. Students use the first number as where they start on the number line; whether the problem uses addition or subtraction gives the direction they will move; the second number is the distance that they will move. Once that is done, they try addition and subtraction with a negative start. Once that is comfortable, they try addition with negative numbers, and eventually subtraction with negative numbers.  I like the use of a vertical number line because I think “up –down” is easier to conceptualize that “right – left”.  The author of this approach specifically says that he avoids analogies. I appreciate that, though I think stories are sometimes easier to remember than procedures. Of course, analogies only go so far and should be used judiciously. He also makes a point of separating addition/subtraction from multiplication. As such, he never says something like “two negatives make a positive”. Personally, I think this approach sounds procedurally very useful since there is nothing arbitrary or ad hoc about it. Perhaps the deeper meaning of why it works will appear spontaneously to the students, but at the very least, they will know how to do the approach correctly.

Hot Air Balloon


I like this analogy less, the more I think about it, but I think it does have its uses. Imagine a hot air balloon. Puffs of hot air are positive numbers. Sandbags are negative numbers. Adding hot air moves you up. Subtracting hot air moves you down. Adding sandbags moves you down while removing sandbags moves you up. I won’t elaborate on how the analogy works. I think it is pretty obvious. It is certainly a cute picture and it gives a clear idea of how removing something can cause an increase. However, I’m not sure that the analogy is terrible useful for learning how to do actual calculations. I would use it as a picture for a confused student, but I would be hesitant to lead with it. One nice thing about this analogy is that there is a game that goes with it, which may be a fun activity.

White and Black Stones


This analogy is from Marian Small and I think greatly overcomplicates the matter. As a matter of honesty, I vehemently dislike almost everything I’ve seen from her, so I may have been a bit biased reading this. In her procedure, students are encouraged to represent positive integers as empty circles and negative integers and shaded circles. One positive circle will cancel with one negative circle (what she call the “zero principle”). Once all the possible cancellations are done, the student counts what is left over. The procedure works smoothly for some combinations of numbers but becomes very complicated for others. I generally don’t like Small’s reliance on cumbersome manipulatives and complicated visual metaphors. The metaphor should never be the procedure, in my opinion. It breaks down a bit when we get to multiplication where she admits that there is no easy way to model the product of two negative numbers. I will concede that her “zero principle” did grab my attention. It was an interesting way of demonstrating that zero can always be rewritten as the addition of a number and its negative, which pops up later down the road in completing the square.

Friday, 3 March 2017

Trip Planning Activity

For an (imaginary) locally developed math class, we did an interesting open-ended activity. We were given a choice between going bowling or going to a movie, and had to predict how much money we'd need for the evening. This included transportation costs, food, admission, and anything else that may apply. It was a very real application of math. There is sometimes a tension between the exactness of math and the practicality of estimation. I often think estimation and guesswork is crammed into problems where it doesn't belong, so it was nice to see a perfectly appropriate and realistic use of estimation. As the students, we were required to figure out bus fare or approximate the cost of gas. We needed to research the cost of a movie ticket and and try to anticipate what food we'd want and how much it would cost. All in all it was a very useful, dare I say fun, activity. The natural danger of course is that students will not use their phones or computers for the task at hand, and some classroom management will be needed to meet that challenge. However, if you can keep your students on task, I think if would be a very rewarding lesson for them.

Wednesday, 1 March 2017

"Deal or No Deal" Probability Game


A very fun game was played in the math class during a sample lesson on probability. We played "Deal or No Deal", based on the game show. We were divided into groups of two. In each pair, one person was the banker and the other was the contestant. We had a chart covered in cards, each of which having a dollar value on the underside of the card. The contestant picked a card at random, and the banker and contestant then haggle over how much the banker will pay for the card. During each round, the values on the remaining cards are gradually revealed, giving the contestant and banker information with which they can try and figure out how much the contestant's card might be worth. The trick is that the banker wants to buy the card for less than it's worth and the contestant wants to sell it for more than its worth. To take an extreme case, suppose all the cards have been revealed and we know that the contestant's card is either worth $1 or $500,000. If the banker offers $250,000, each player has a 1/2 chance of making or losing $250,000. Would that be a good offer from the banker? Perhaps. The interesting part of this game is that while the probability is important, there is also a lot of room for judgement. If I was the contestant, I would take the $250,000. If I was the banker, I would probably offer a lot less than $250,000 since I would rather earn $500,000 or nothing than make or lose $250,000. However, since the contestant only stands to gain, there may be a "bird in the hand" type of reasoning that would make the guarenteed $250,000 more attractive than the $500,000 or nothing. In short, there's a lot of higher-level thinking that can go into strategy for this game, and could have interesting applications in financial math and economics as well. If I ever get to teach data, it's definitely a game I would try to incorporate.

Wednesday, 15 February 2017

Student-Made Review Booklets

A very interesting idea was presented last week in our Grade 11 presentations. We were shown how to make little review booklets. These can serve as a quick reference material for the student, a study guide, perhaps even as a formula sheet for a test. I liked that this approach requires the students to make their own (as opposed to using a pre-made reference sheet). In grade 8, my history teacher had us make a table of contents in the front of our binders. We'd add to the table of contents as we took notes (and put page numbers on the top corners of our notes). This was a great lesson in organization and I see something similar in this. By this method, students have a short reference of everything they need to know, which may help their studying (since textbooks can be cumbersome sometimes). This would be a great method for physics as well, which has a lot of content and can be difficult to organize.

Generating Plots Using Motion Detectors

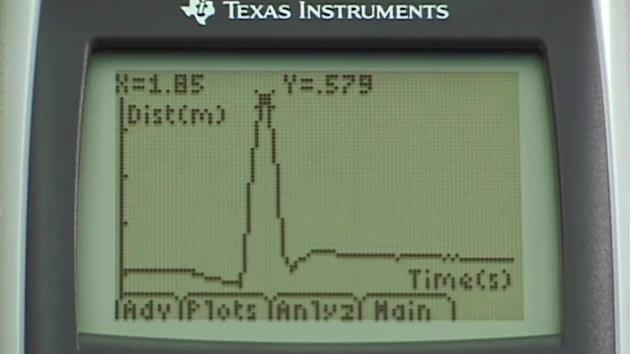
This week, an interesting application of TI graphing calculators was demonstrated. A calculator was connected to a motion detector which allowed a person walking in front of the detector to create a position-time graph. The exercise we were given was to recreate a given set of plots using the motion detector. It was a great way to connect slope with rate of change. The obvious physics applications didn't escape me. Kinematics, the unit that traditionally begins 11 Physics, requires developing an intuitive understanding of the position-time graphs. Students often have a difficult time relating what they see on the plot to a mental picture of actual motion. Curvature, as it relates to acceleration is particularly tricky. There is a difference between acceleration and "getting faster". Being able to create their own motion and seeing it plotted would be a very useful experience. Another difficulty students have is understanding that at turning points of a position-time curve, the speed is instantaneous zero, even though the acceleration is always non-zero. This would also be a useful exercise in calculus, when the topic of second derivatives come up.


Saturday, 28 January 2017

Introducing the Concept of Proof to Students

This week we saw four more interesting miniature lessons. By a good coincidence, three of them dealt with mathematical proof to differing extents. I want to speak about one lesson in particular, which covered the following geometry problem:

https://static.guim.co.uk/sys-images/Guardian/Pix/pictures/2014/10/16/1413457021371/da4d4757-3177-4772-88e4-e481c7cdc8ee-bestSizeAvailable.gif


The object is to determine the sum of the three angles indicated in the figure. I believe this puzzle originated with Martin Gardner (an excellent source for clever math problems and riddles) but I am not positive. We were given Geoboards and elastic bands as tools to help solve the problem. In addition, we we cut up a copy of the figure in order to see that the three angles should sum to a right angle. Although it's a very good problem, this was a rather difficult exercise (perhaps due the fact that we weren't expecting it). It made me wonder how it would be received by grade 10 students. However, if they had been working up to this exercise over the term by doing simpler geometric proofs, perhaps it would not catch them as off-guard. It is probably easier in the beginning to learn proof by proving the obvious, so whether this problem is at-level would depend on how many similar exercises the class had already seen. It is definitely the type of thing that needs to be seen by students more often, and early. If I had a choice, I would have done an algebraic proof, but being forced to do a geometric proof showed me how bad I really am at that kind of thing.

My first real encounter with proof was a second year university algebra course and it completely revolutionized my impressions of mathematics. It was not difficult, it taught me to think, and I really wished that I had seen something like that earlier. Another benefit of proof, particularly of the geometric kind, is that is does not use numbers. It is a purely logical/visual expression of math which I imagine many students may find refreshing, particularly those whose numeracy may be lagging behind their peers. Does the prevalence of calculation, data, word problems etc. perhaps create an implicit bias in the students' minds with respect to what mathematics actually is? Even geometry, when it is taught, is less about structure and more about numerical quantities of area, volume and so on. Which is more fundamental after all, shape or quantity? In schools, quantity seems to be hands-down winner of that debate (whether the debate ever took place I do not know). Perhaps it may be that the math class could do with fewer numbers.