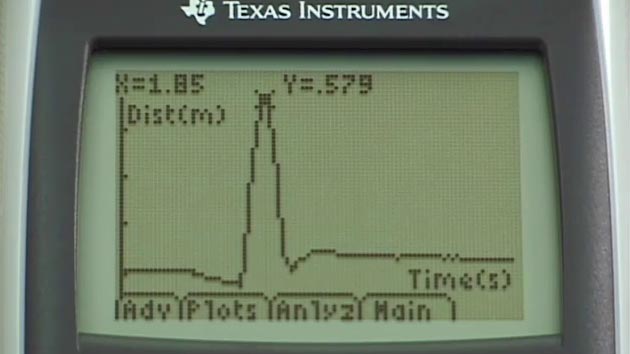
This week, an interesting application of TI graphing calculators was demonstrated. A calculator was connected to a motion detector which allowed a person walking in front of the detector to create a position-time graph. The exercise we were given was to recreate a given set of plots using the motion detector. It was a great way to connect slope with rate of change. The obvious physics applications didn't escape me. Kinematics, the unit that traditionally begins 11 Physics, requires developing an intuitive understanding of the position-time graphs. Students often have a difficult time relating what they see on the plot to a mental picture of actual motion. Curvature, as it relates to acceleration is particularly tricky. There is a difference between acceleration and "getting faster". Being able to create their own motion and seeing it plotted would be a very useful experience. Another difficulty students have is understanding that at turning points of a position-time curve, the speed is instantaneous zero, even though the acceleration is always non-zero. This would also be a useful exercise in calculus, when the topic of second derivatives come up.


No comments:
Post a Comment